
The following slide show is a brief introduction on how you can start up your own NGO.
Fellow Classmates Blogs

This semester has flown by quickly. It was a pleasure to explore Douglas County throughout this semester. Each of my classmates chose other areas to explore and below are links to blogs that were created throughout this semester.
Barbara – Lake Mendocino
Carey – Great Falls, VA
Christina – Monterey Bay
Joel – Green Crabs (MA)
Jessica – California
Jonette – Chincoteague
Lindsay – Bays Mountain
Shelley – Wake Co.
Siobhan – Fitton Green
William – SW Virginia
Spotlight: NGO of Douglas Count – Umpqua Watershed
In this post we will briefly explore one of Douglas Counties Nonprofit Organizations – the Umpqua Watershed.
Common Trees of Douglas County

In the slideshow below are a few common tree species found within Douglas County Oregon. There are well over a dozen tree species within the county. I chose to highlight a few of my favorite species that call this county home.
References and a few facts found in speaker notes feature
Using Bumble Bee Watch to Identify Bumble Bees of Douglas County

The Xerces Society in collaboration with many organizations have created a website and app to track and identify bumble bees throughout the United States. This app and website is open to everyone; public, scientists, hobbyist naturalist, etc. This is a great app to learn to identify your local bee species because the identification program walks you through the identification based on what you are seeing.
The website can be found here as well as directions to download the app onto your phone through an app store: https://www.bumblebeewatch.org/
When you submit photos of bumblebees, it is a good idea to take three photos’; photo of the face, the side, and the back view of the bee. This helps other scientists to identify your bee as well as observe different variations on a species. Here is an example of what the process is like.
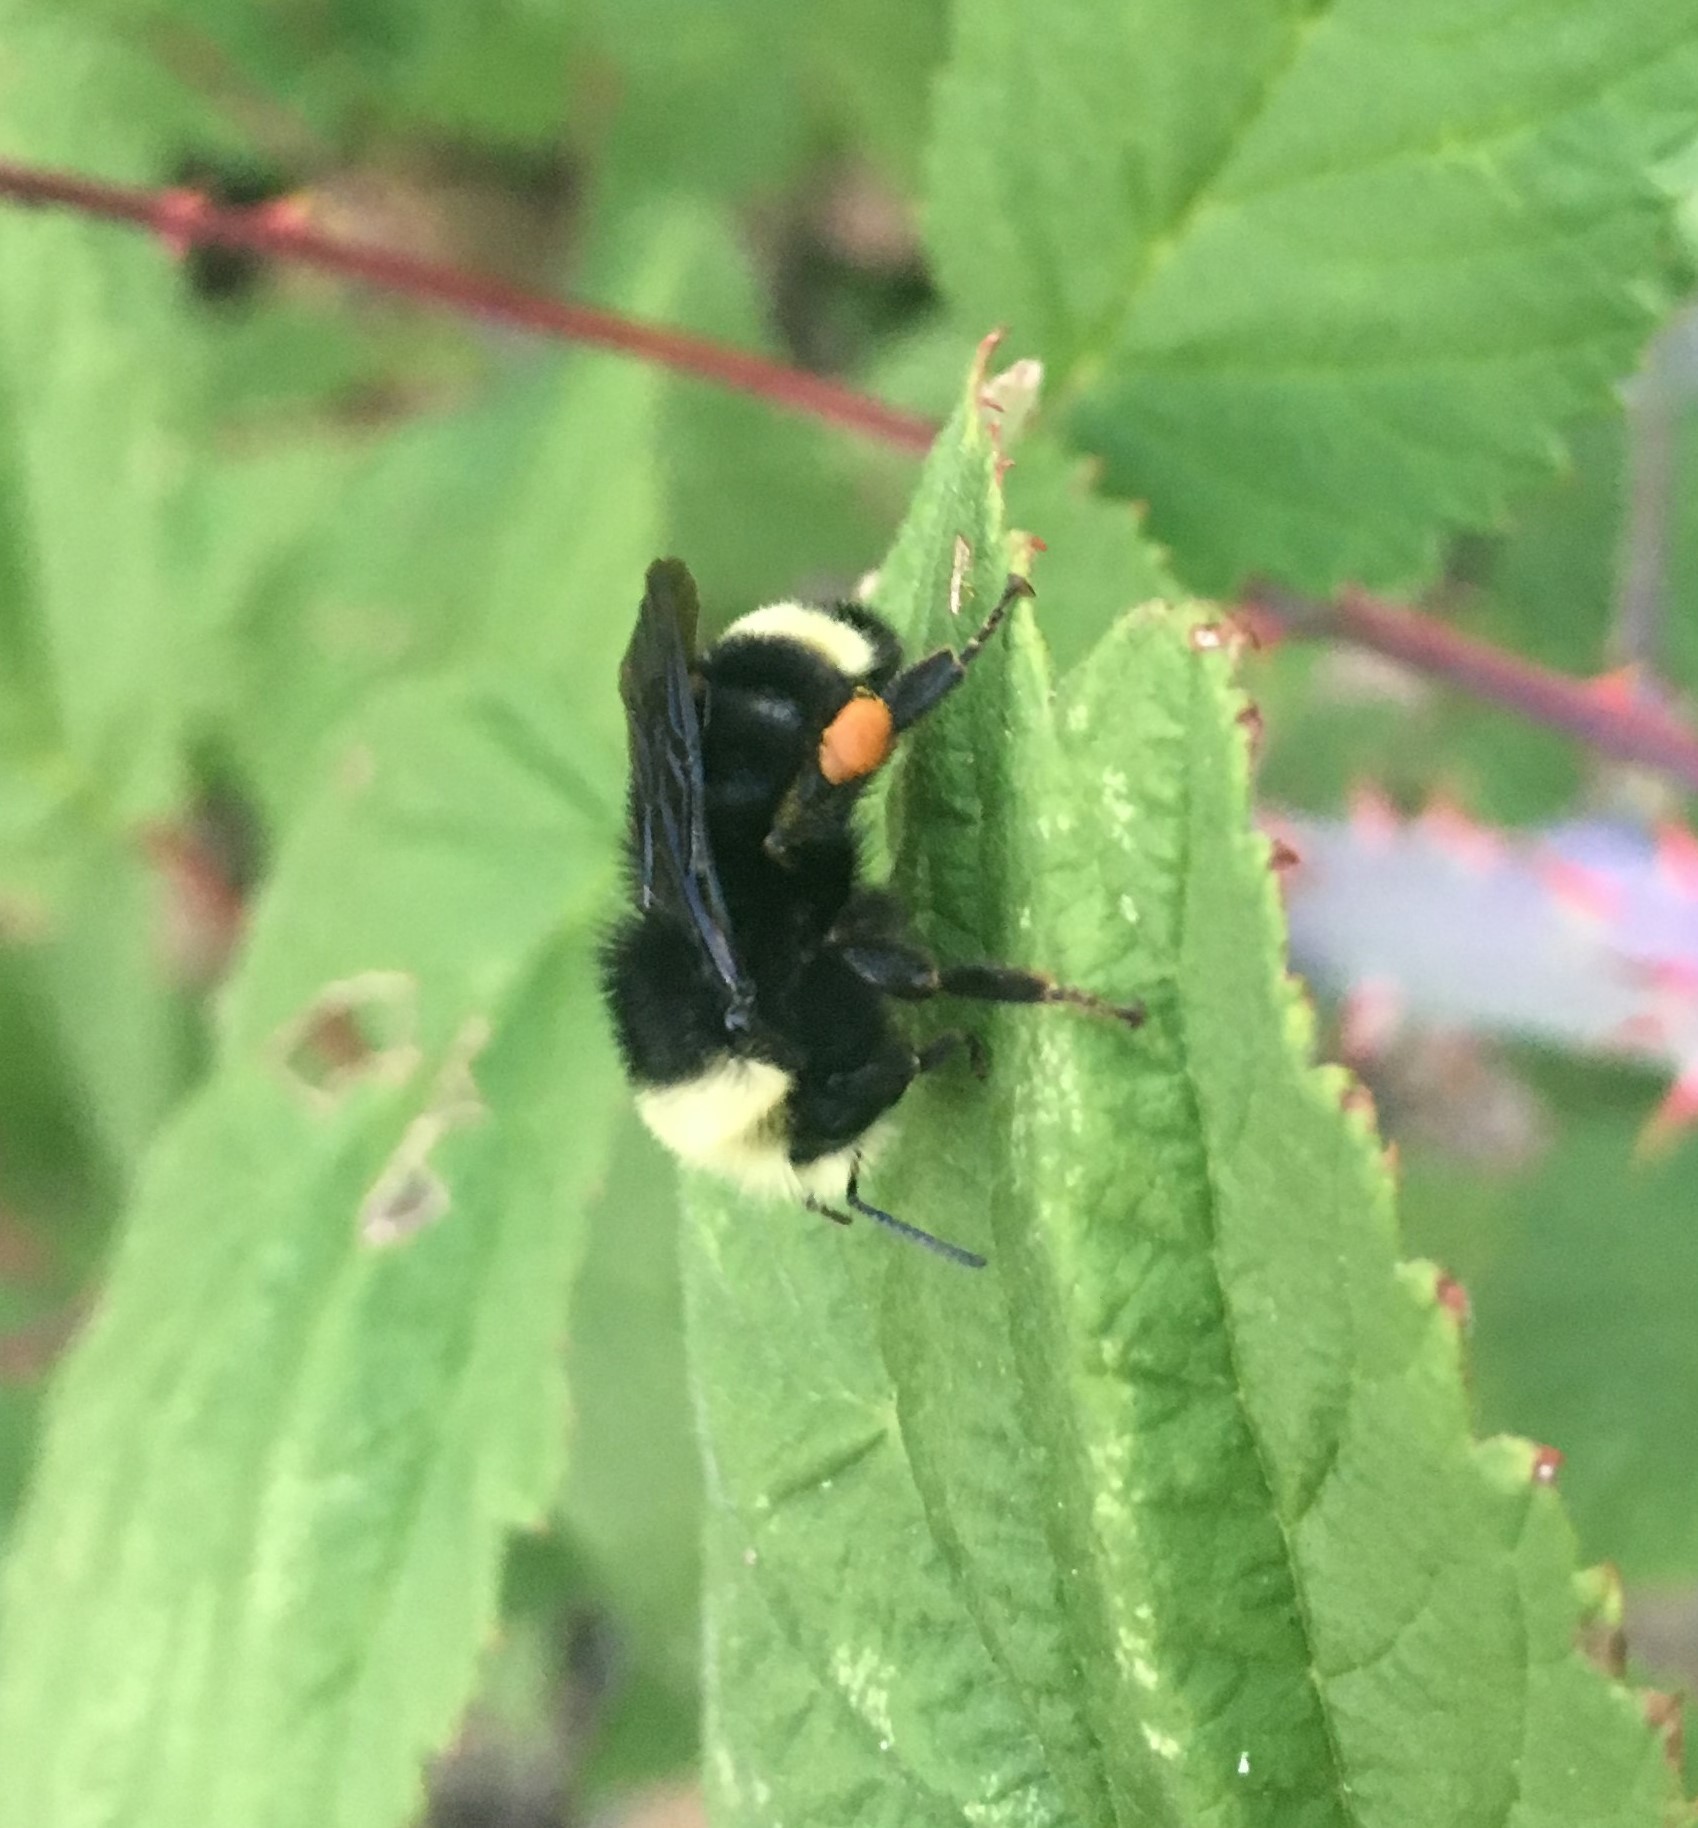

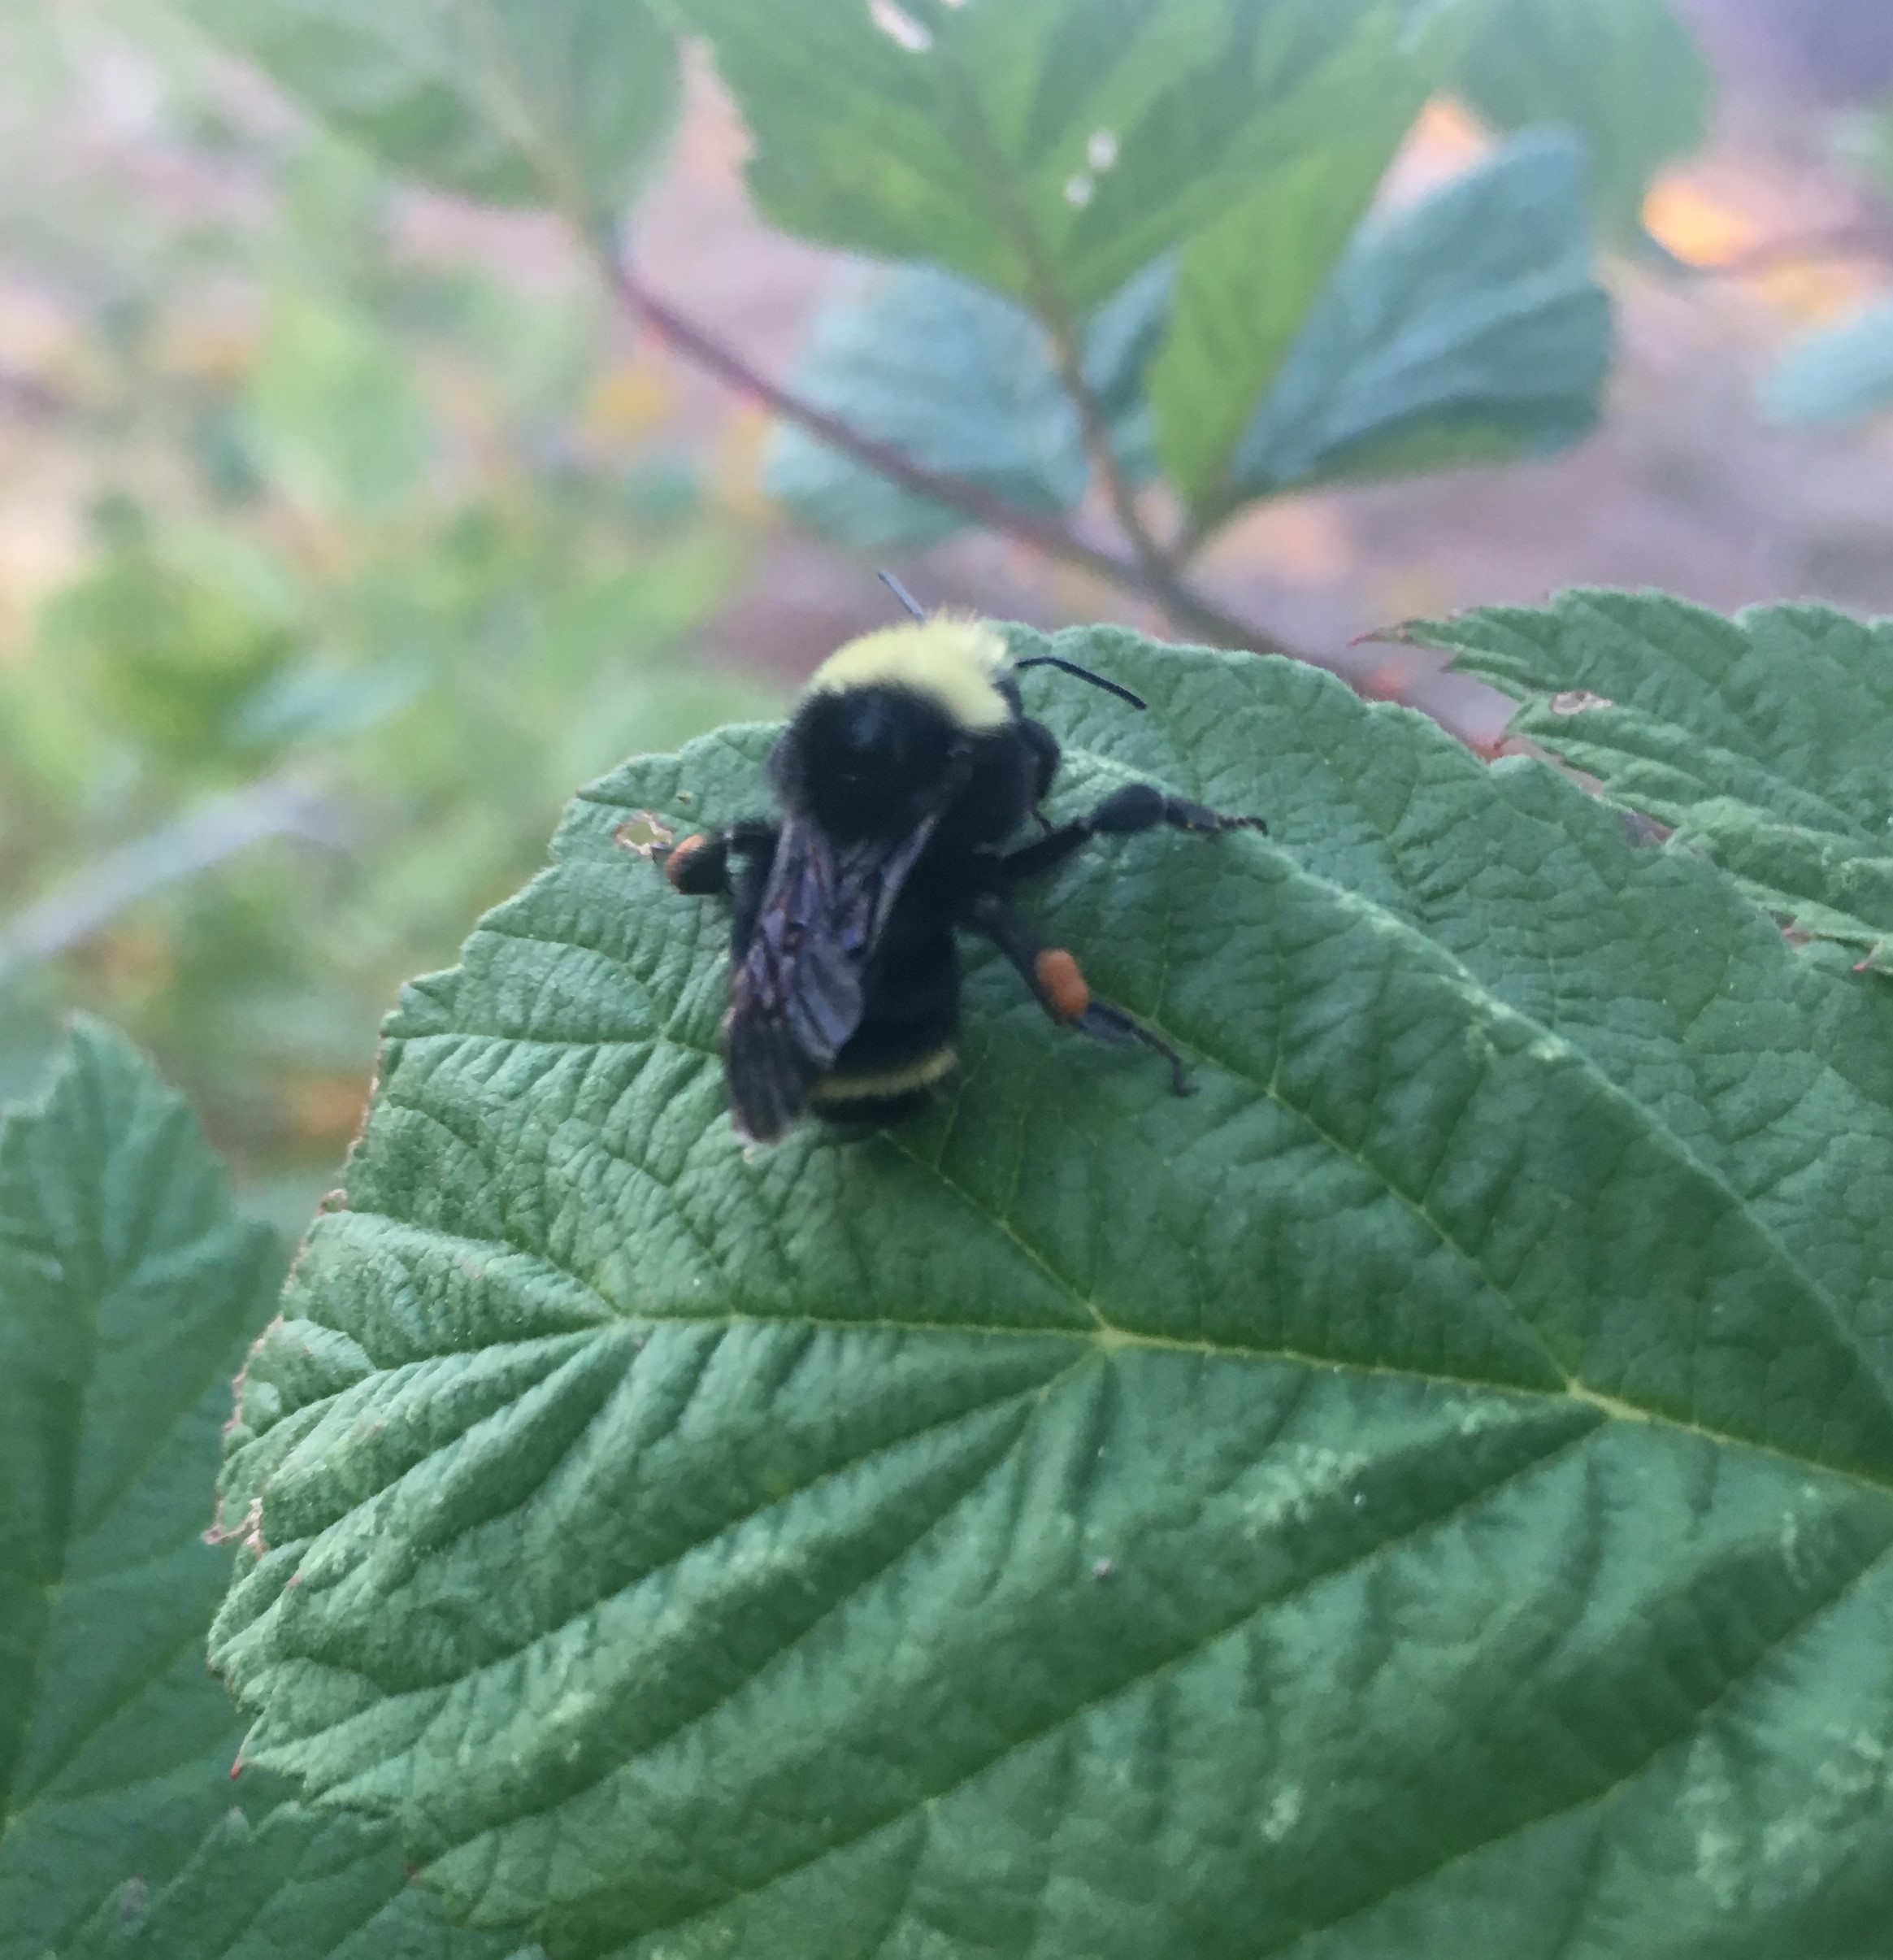
In this example, I took photos of Bombus vosnesenskii. Here I was able to take a face, side and back view of the bee. This is not always the case, depending on the time of day, bees can be very active and don’t stay still for very long. The key is to at least get one clear photo of the bee you wish to identify.

Once you create a profile on the website, you can submit an observation under the “Recording a Sighting” tab. You’ll then be redirected to a new page to add your photos and other information; like the location, vegetation, and habitat notes.


You can also contribute your observation to an ongoing project. For this example, I submitted my observation the PNW Bumble Bee Atlas. After entering information, you are again redirected to another page.

This is where it gets fun! Based on what you observed you choose pictures for each identifiable feature of the bee. After each selection, the selection of bumble bee species list to the right starts getting smaller until it is down to one or a few species to choose from.


After choosing a species, your observation is submitted for review by a professional. This can take awhile for them to get to your observation but once it is, it will either get a green checkmark indicating that your observation and species has been confirmed. Or you get a red ‘x’ which indicates a correction. My biggest critic with the website/app is the wait time to find out if you identified your bumble bee correctly.

Another neat feature of the Bumble Bee Watch website/app is the bumble bee species profiles that you can learn more about the bee species in your area.


Do not get disheartened if you miss-identify a bumble bee! Bumble bee species have many variations within the same species that make them look like other species. The best way to learn how to identify your local bumble bee species is to keep observing!
All screenshots were taken on the Bumble Bee Watch website (c) Bumble Bee Watch. The three example photo’s of Bombus vosnesenskii were taken by myself.
Invasive Species of Douglas County
There are many invasive species that have started calling Douglas County Oregon home. In this slide show we will get familiar with just a few of these invasive species.
Exploring Soil Information of Douglas County

One tool to use while exploring the soils that make up Douglas county is the USDA NRCS Web Soil Survey maps and database, found here: https://websoilsurvey.sc.egov.usda.gov/App/HomePage.htm
No downloading of programs required to use this tool. This makes it accessible for everyone, and anyone can use it.

For this post I decided to check out a few of the features and soils in parts of Douglas County. One thing I learned right away is that the you wish would explore the soil data of can not be larger than 100,000 acres. I had to choose a few spots in the county to view the data on instead of being able to view data on of the entire county. In some areas, soil data is not available.


When there is data available for your area of interest, the program lists out and describes each soil type and identifies it by a number. There is a plethora of soil information available to view within this mapping program. From disaster reclamation, to fire prone soils; there is usually a lot of data to explore in your designated area of interest. In this case I wanted to view soil susceptibility of wildfires in the North Umpqua region of the Umpqua National forest along the Diamond Lake Highway.

Here you can see that there is a mix of susceptibility. This data set shows that in this area soils are more likely to be susceptible to the impacts of wildfires. Meaning that wildfires will have a significant impact on the current soil types.

Image captured on USDA NRCS Web Soil Map 2019
Climate Data For Oregon and Douglas County,OR.
Finding data on climate can be a difficult task. Weather forcasts are a bit easier to find whether by the local news channel or radio station. Here are some sites I found that have more in depth climate information.
US Drought Information, Pacific Region: https://www.drought.gov/drought/documents/quarterly-climate-impacts-and-outlook-pacific-region-june-2019
US Climate Data for Roseburg, OR: https://www.usclimatedata.com/climate/roseburg/oregon/united-states/usor0298
Current weather for the region, National Weather Service: https://forecast.weather.gov/MapClick.php?zoneid=ORZ023 , https://www.weather.gov/
Coop program: https://www.weather.gov/coop/Overview
GIS data, shapefiles and other GIS information can be found: https://www.weather.gov/gis/
Seasonal Climate Forecast for Oregon: https://www.oregon.gov/oda/programs/naturalresources/pages/weather.aspx
Map of Douglas County OR
This was the first time I used googles MyMaps program. It’s a pretty strait forward program and easy to use regardless of computer skills. This program allows you to add points of interest to highlight study areas or share your adventures.
Something that would be nice to have as a feature, unless I missed this feature, is to be able to outline counties or be able to draw in boundaries to highlight an area of interests.
This is a living map and will be edited constantly.
